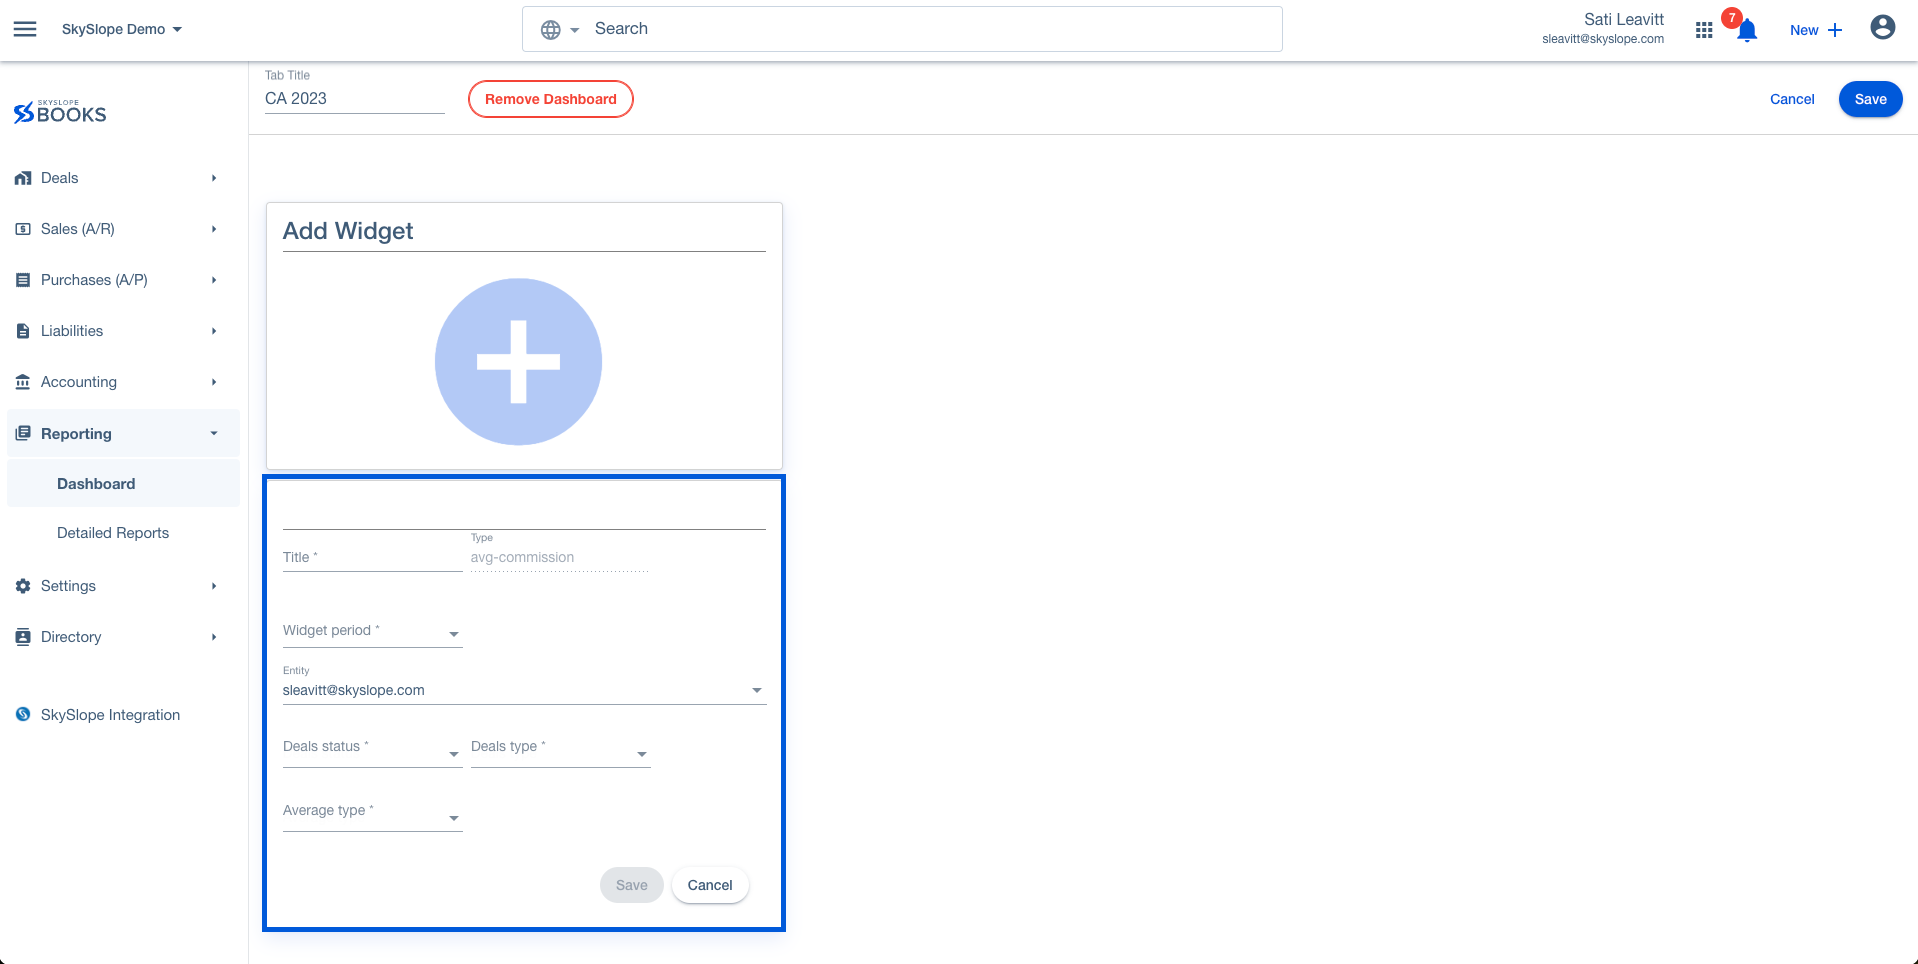
The Average Price Widget allows you to keep track of the average sales price of your deals by deal status and/or type for the current week, month, quarter, year, or a custom date range.
Getting Started
1. Under the Reporting module, Navigate to the Dashboard you want to customize.
2. Click Edit Dashboard. Then the + icon under Add Widget.
3. Select the Widget Type. In this article, we will go over creating the Average Price Widget.
Required Fields for the Widget

- Title: The title you want to name your widget for your Insights board
-
Widget Period: You can choose from:
- Current week
- Current quarter
- Current month
- Current year
- Custom date
- Entity: The Profile you want to see the data for. By default, it populates to the signed-in user. You can change it to company or custom
- Deal Status: You can choose one or multiple deal statuses from the available SkySlope Books statuses
- Deal Type: You can choose Buyer, Listing, or both
What does the widget show?

This widget shows the average Sales Price of all the deals for the brokerage from January to March. The widget separates the data based on Buyer and Seller deal types.
Hover your cursor over Buyer or Seller to see more details.
Note: The widget takes into consideration all the deals the selected contacts are a part of, whether they are the primary agent, just an agent, or even a financial transfer.
Was this article helpful?
That’s Great!
Thank you for your feedback
Sorry! We couldn't be helpful
Thank you for your feedback
Feedback sent
We appreciate your effort and will try to fix the article
<\br>